Blog

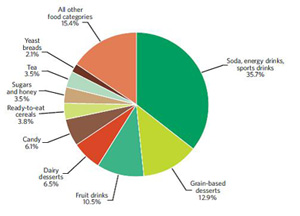
During the summer many of us grab drinks to take on walks, hikes, bike rides, picnics, cookouts, etc. Many times those drinks are loaded with sugar and calories. In fact, the new 2010 Dietary Guidelines indicate that added sugars contribute an average of 16% of the total calories in American diets. And 36% of those calories come from soda, energy drinks and sports drinks (see the chart below). That’s more than candy, ice cream, cakes, and cookies combined.
Strong evidence shows children and adolescents who consume more sugar-sweetened beverages have a higher body weight compared to those who drink less of these beverages. Moderate evidence also supports this relationship in adults.
Sugar-sweetened beverages provide excess calories and few essential nutrients to the diet. Reduce the intake of sugary drinks by:
- Drinking fewer sugar-sweetened beverages
- Consuming smaller portions
- Substituting water and other beverages with few or no calories for sugar-sweetened beverages
If you want to get an idea of how many teaspoons of sugar and calories there are in various beverages, play Interactive Beverage Guide to Sugars. Show the website to your children and encourage them to decrease the sugar they get through sweetened beverages.
Sources of added sugars in the diets of the US Population ages 2 years and older
If you would like a closer look at this chart go to: http://www.health.gov/dietaryguidelines/dga2010/dietaryguidelines2010.pdf and then to page 29 where you will find FIGURE 3-6 Sources of Added Sugars in the Diets of the US Population Ages 2 years and Older.
– pointers from Peggy

